UberChart 1.34 – WordPress Chart Plugin
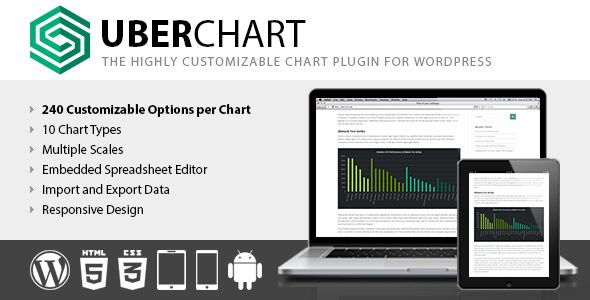


Introducing UberChart 1.34 – The Ultimate WordPress Chart Plugin for Dynamic Data Visualization
In today’s digital landscape, presenting data effectively is crucial for engaging your website visitors and conveying complex information with clarity. UberChart 1.34 emerges as a powerful WordPress chart plugin designed to transform static data into visually appealing, interactive charts. Whether you’re a blogger, business owner, or data analyst, UberChart offers an extensive suite of features that make chart creation intuitive, customizable, and highly versatile.
Why Choose UberChart 1.34? Key Features and Benefits
UberChart stands out in the crowded market of WordPress plugins because of its rich feature set and user-friendly interface. Here are some compelling reasons why you should consider integrating UberChart into your website:
- Multiple Chart Types: Create diverse visualizations including line, area, bar, horizontal bar, pie, doughnut, radar, polar area, scatter, and bubble charts.
- Exceptional Customizability: Fine-tune every aspect of your charts, from colors and labels to animations and tooltips, ensuring they match your website’s style.
- Responsive Design: All charts are fully responsive, providing optimal viewing experiences across desktops, tablets, and smartphones.
- Ease of Use: Intuitive drag-and-drop interface and straightforward configuration options enable users of all skill levels to craft professional charts effortlessly.
- Data Import Options: Import data seamlessly from CSV files or connect with external data sources for real-time updates.
- Performance Optimization: Lightweight code ensures fast load times, even with complex datasets.
Comprehensive Chart Types for Every Need
UberChart’s extensive variety of chart types allows you to visualize data in the most effective way possible. Here is a detailed overview of each supported chart:
| Chart Type | Description | Ideal Use Cases |
|---|---|---|
| Line Charts | Display trends over time with smooth lines connecting data points. | Sales trends, stock prices, website traffic analysis. |
| Area Charts | Similar to line charts but fill the area beneath the line for emphasis. | Market share comparison, cumulative data visualization. |
| Bar Charts | Vertical bars representing data values for easy comparison. | Survey results, sales per product category. |
| Horizontal Bar Charts | Bars extend horizontally, suitable for long category labels. | Ranking data, comparative analysis with lengthy labels. |
| Pie & Doughnut Charts | Visualize parts of a whole with circular segments. | Market Share, Budget Allocation. |
| Radar & Polar Area Charts | Display multivariate data in a circular layout. | Skill assessments, performance metrics. |
| Scatter & Bubble Charts | Plot data points in two or three dimensions for correlation analysis. | Financial data, scientific research. |
How to Use UberChart: Step-by-Step Guide
Getting started with UberChart is straightforward. Here’s a quick guide to help you create your first chart:
- Install and Activate: Download UberChart from the official repository or purchase the premium version. Upload and activate the plugin in your WordPress admin panel.
- Configure Data: Input your dataset manually or import via CSV for bulk data management.
- Select Chart Type: Choose the most suitable chart type for your data from the available options.
- Customize Appearance: Adjust colors, labels, tooltips, animation effects, and responsiveness settings to match your website’s style.
- Insert into Posts or Pages: Use the provided shortcode or Gutenberg blocks to embed your charts seamlessly into your content.
Performance and Compatibility Considerations
UberChart is designed to be lightweight and compatible with most WordPress themes and page builders. However, to ensure optimal performance:
- Disable Ad Blockers: Some users have reported issues with ad blockers interfering with plugin functionality. If you encounter problems, try disabling ad blockers for your site.
- Update Regularly: Keep UberChart and your WordPress core updated to benefit from the latest features and security patches.
- Browser Compatibility: The plugin works well across modern browsers, but if issues arise, switching browsers might help.
Pricing and Download Options
UberChart offers a free version with essential features suitable for basic charting needs. For advanced functionalities such as additional chart types, advanced customization, and priority support, consider upgrading to the premium version.
| Version | Features | Price |
|---|---|---|
| Free | Basic chart types, simple customization, CSV import. | $0 |
| Pro | All features including premium chart types, advanced styling, priority support. | Price varies based on licensing options. |
Download UberChart 1.34 today and elevate your data presentation!
Frequently Asked Questions (FAQs)
Q1: Is UberChart compatible with all WordPress themes?
Yes, UberChart is designed to be compatible with most modern WordPress themes. However, for best results, use themes that follow standard coding practices.
Q2: Can I create interactive charts with UberChart?
Absolutely! UberChart supports interactive features such as tooltips, hover effects, and animations to enhance user engagement.
Q3: How do I troubleshoot issues with the plugin?
If you experience problems, ensure your WordPress and plugin versions are up to date. Disable any ad blockers or conflicting plugins. For persistent issues, contact the support team through the official channels.
Q4: Is there a limit to the number of charts I can create?
No, there is no limit. You can create as many charts as needed to suit your website’s content requirements.
Conclusion: Unlock the Power of Data Visualization with UberChart 1.34
In summary, UberChart 1.34 offers a comprehensive, user-friendly solution for creating stunning and customizable charts on your WordPress website. Its wide range of chart types, ease of use, and flexibility make it an excellent choice for anyone looking to enhance their data storytelling. Whether you’re showcasing sales data, survey results, or scientific research, UberChart provides the tools you need to communicate effectively and professionally.
Don’t miss out on transforming your data presentation—download UberChart today and start crafting compelling visual stories that captivate your audience!